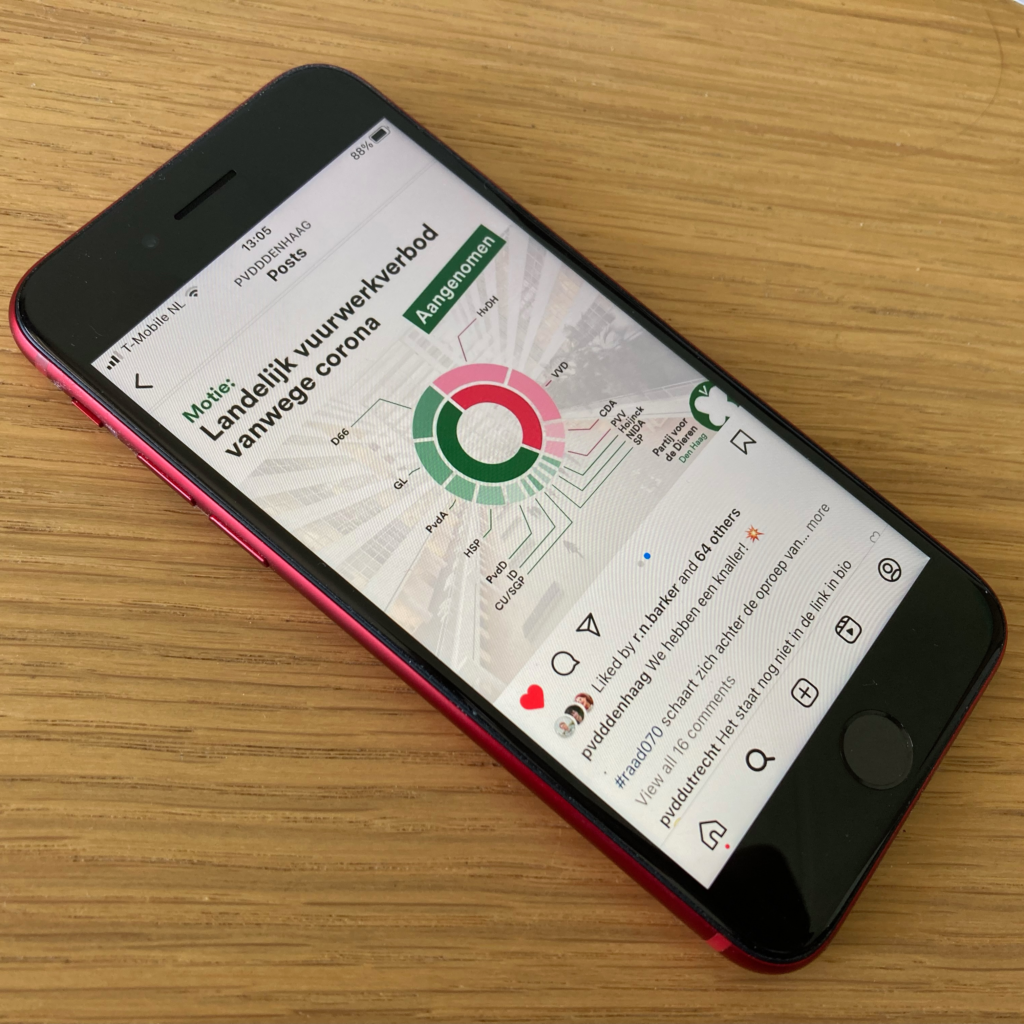
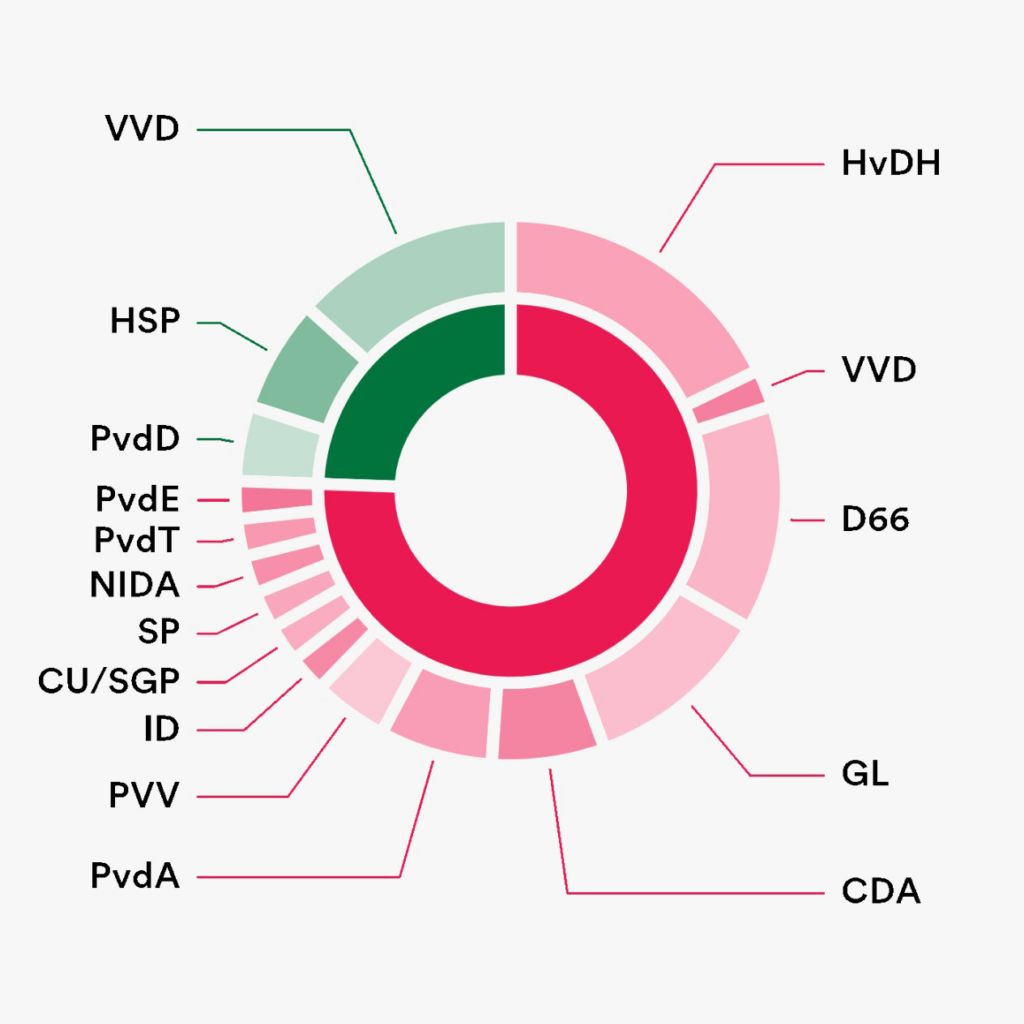
For a Dutch political party, active in the municipality of The Hague, I designed pie charts showing the voting results for their motions, amendments and other proposals in the city council.
The graphs are vector images generated through Python and Anaconda. The party uses the Python code I wrote on an ongoing basis to create different infographics for social media.